Results / Earning Events Statistics
By ORTEX Research
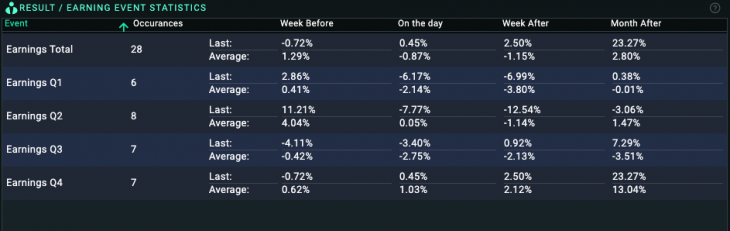
The percentage change in the company’s price a week before, on the day of, a week after and a month after earnings are reported can be seen here for Q1, Q2, Q3, Q4 and as a whole.
Users can view the number of times earnings have been reported, and the percentage change in price the last time these events occurred and on average.
Users can view a history of previous earnings, and the dates they were released, that form the average by hovering over the figures in the ‘Average’ row.
See ORTEX data live.
The same proprietary data behind this article, on the platform, by API and in Excel.
Try ORTEX free →