Historical events chart
By ORTEX Research
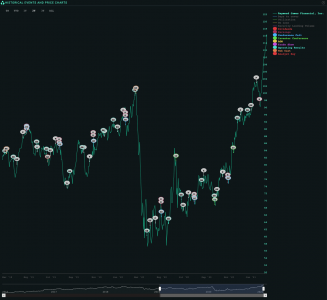
This chart shows the company’s price with company events plotted on it. As always users can change the time frame on the grey axis and click an event on the legend to hide or show in on the chart.
See ORTEX data live.
The same proprietary data behind this article, on the platform, by API and in Excel.
Try ORTEX free →