Percentiles and recent trading signals
By ORTEX Research
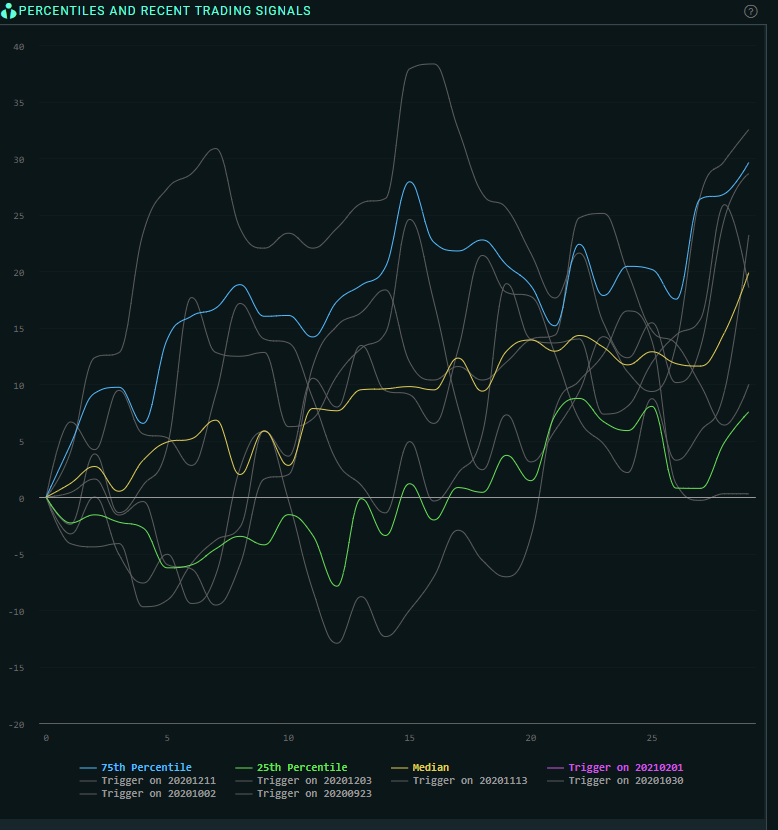
This chart shows you the percentage moves of the stock in the days following all the previous times the signal was triggered. Each line chart represents a previous signal and you can see % return versus days. You can see from the chart axis, the date on which the signal was fired or you can hover over the lines.
See ORTEX data live.
The same proprietary data behind this article, on the platform, by API and in Excel.
Try ORTEX free →